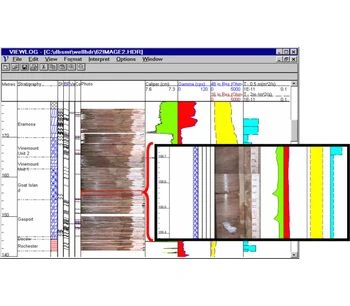
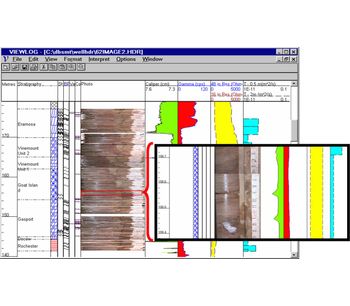
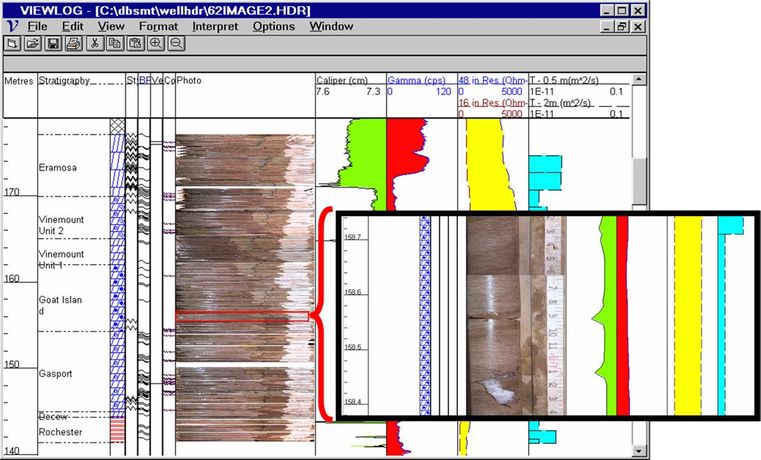
The Log Editor includes functions to edit, display and interpret a variety of borehole measurements, such as geological description, core photos, lithology symbols, well construction details and geophysical logs.
Features
Features include:
- Data Display
- All aspects of log display and scaling are under user control
- Log Editing
- There are powerful features for stretching, smoothing, trimming, re-sampling, averaging and linking logs. Data can be edited point-by-point, if necessary.
- Log Calculations
- Users can write log-processing equations to generate new logs or to correct existing ones.
- Lithologic Interpretation
- You can create multiple columns of contact lines and text interpretation to display beside the logs.
- Lithological symbols can be customized.
- Templates
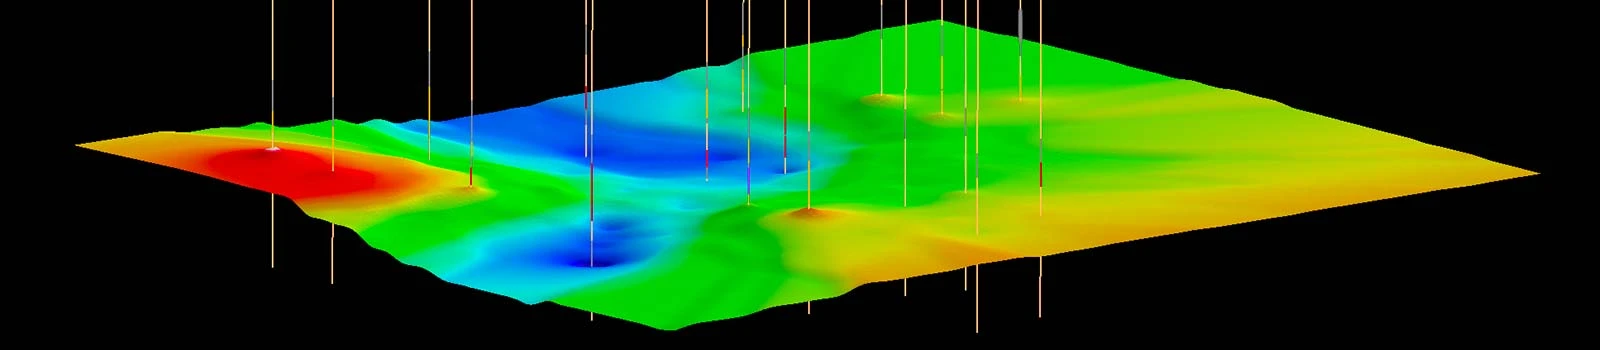
- You can set up log templates such that boreholes can be displayed in a consistent manner for (i) cross section, (ii) 3D, and (iii) Preview mode for individual borehole logs.
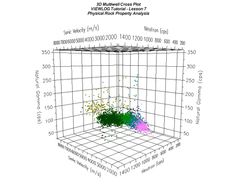
Cross Plotting
- Cross Plotting
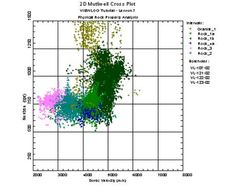
- You can cross plot any two logs with any combination of linear and logarithmic scaling. Polygons can be drawn on a cross plot to identify depth intervals
Z plots
- Z plots
- Select a third lot for classifying the symbols on a plot to create a Z-plot. Use symbols or numbers to identify the Z-log value and combine it with polygons to identify depth intervals.